The Pullback Before the Breakout
Gold is down roughly 27% from its January record. Every great gold bull market contained a decline like this one. So did every gold bear market. Here is what actually separates the two — and what would have to be true for this one to resolve higher.
The two things that look identical
In the middle of a decline, a correction and a top are indistinguishable. Both feel like being wrong. Both produce the same headlines, the same confident explanations, and the same quiet decision by a lot of investors to stop looking at the statement.
The difference is never visible in the price. It is visible in whether the conditions that produced the advance are still in place.
Gold's run from 2023 into January 2026 rested on three things: sustained central bank accumulation, fiscal deficits no political configuration appears willing to close, and reserve managers looking for assets that sit outside dollar infrastructure. A 27% drawdown does not, by itself, tell you that any of those three has changed. It tells you that positioning got crowded, that volatility spiked past 50%, and that the investors who arrived last left first.
What history says about the shape
Since the end of Bretton Woods in 1971, gold has fallen more than 20% from a record high on eight occasions. The average of those drawdowns was 36%; the median was 29%. The current decline sits at roughly 25% to 27% depending on the price series used — inside the historical range, not beyond it.
That is context, not comfort. Here is what those episodes actually did next.
Gold fell from about $195 to roughly $103. The consensus verdict was that the gold story was finished and the bubble had burst. From that low it reached $850 by January 1980.
Gold fell roughly 45% from its 2011 peak over four years, then spent four more going nowhere before making new highs in 2020. The thesis was eventually right. Most of the people holding it in 2013 were not still holding in 2019.
From the January 1980 peak, gold declined for two decades to roughly $250. In most of those years, someone was describing the move as a pullback before the breakout. They were describing a bear market.
The 1980s comparison is the one worth taking seriously, because it is the case where the drivers genuinely did reverse: Volcker restored the credibility of the currency, real rates went sharply positive, and central banks became net sellers of gold rather than buyers. Those are the specific conditions to watch for. They are not the conditions that exist today — but they are what a real breakdown would look like.
What would have to be true
The World Gold Council's mid-year framework puts gold's fair value near $4,100 with a ±5% band, which means at current prices the market is roughly where macro consensus says it should be. A breakout from here is not a matter of gold being cheap. It requires a catalyst, and the Council identifies three: deteriorating economic or geopolitical conditions, a reversal in interest-rate expectations, or sustained participation from long-term investors. Their scenario work places a resumed uptrend near $4,500, with a sustained move toward $5,000 requiring a strong and unambiguous signal rather than drift.
Their published sensitivities give a sense of what actually moves the number, all else equal:
| Variable | Move | Effect on gold |
|---|---|---|
| US 10-year yield | −25 bp | Roughly +1.75% |
| Consumer price inflation | +1% | Roughly +0.5% |
| Central bank buying above trend | +20–30t | Roughly +1% |
| Geopolitical risk index, monthly | +100 pts | Roughly +2.5% |
Notice the shape of that list. Almost nothing on it is a gold-specific event. Gold does not break out because of gold. It breaks out because of what happens to real rates, to inflation, and to the credibility of the institutions issuing the currency it is priced in.
Which is why the current setup is at least interesting. The Fed is expected to raise rates into a stubborn inflation problem, under a new chair, in a contested midterm year, with sovereign debt burdens that no serious observer describes as sustainable. That is an environment in which the market's assessment of monetary credibility can change quickly — in either direction.
Two sets of conditions
Rather than a forecast, here is the scoreboard — what would confirm each outcome as it develops.
- Rate expectations shifting from further hikes back toward cuts
- Inflation proving persistent rather than transitory a second time
- Official-sector buying accelerating rather than fading
- Renewed stress in credit or geopolitics driving flight-to-quality flows
- Gold reclaiming and holding the 200-day average it broke near $4,500
- Sustained dollar strength and yields rising past current expectations
- A genuine improvement in the market's read on Fed credibility
- Risk-on sentiment pulling capital decisively toward equities
- A marked deceleration in central bank purchases
- A break below roughly $3,860, flagged as the next technical support
The buyer who isn't watching the chart
In June, as gold was finishing its worst quarter since 2013, the People's Bank of China added about 14.93 tonnes — its largest single month since 2023 and its twentieth consecutive month of buying. Chinese official holdings now sit near 2,346 tonnes, still under 10% of total reserves. Central banks as a group bought an estimated 244 tonnes in the first quarter.
This is the part most commentary misses. A reserve manager rebalancing away from dollar exposure over a multi-decade horizon is not looking at the same screen as a futures trader. A lower price makes that program cheaper to execute, not less attractive. It is a price-insensitive bid sitting underneath the market.
It is also the clearest structural difference between this drawdown and the 1980s decline. In the 1980s, central banks were the sellers. Today they are the buyers. That guarantees nothing, but it changes the arithmetic of who is on the other side of a panic.
Why this isn't a normal drawdown
Everything above treats this as a technical question. It isn't, quite. A 27% decline in an ordinary decade is a correction in a commodity. A 27% decline in this decade is a different thing, because of what sits behind it.
I have spent years writing about the institutions at the center of this, and I'm not going to be delicate about it here. The Federal Reserve told Americans inflation was transitory while it was still buying $120 billion of bonds a month. It held rates at zero deep into an inflation it had already been warned about, then raised them more than five percentage points in sixteen months to correct for its own delay. Its balance sheet went from roughly $4 trillion to nearly $9 trillion in two years. That is not a forecasting error at the margins. That is a sustained misreading by the institution with the best data and the most resources of anyone in the country.
- Inflation called transitory through 2021 — the word was retired that November; inflation peaked above 9% the following June
- Bond purchases of $120 billion a month continued into 2022, with prices already running hot
- A balance sheet expanded from roughly $4 trillion to nearly $9 trillion in about two years
- Federal debt from roughly $23 trillion before the pandemic to approaching $39 trillion now
- Deficits at a scale once reserved for war or depression, run in an economy at full employment — by both parties, with no plan from either to stop
Washington's half of this is in some ways worse, because it doesn't even involve a mistake. Nobody in either party is confused about the arithmetic. They have simply decided the bill is someone else's problem, and the political system has stopped asking them to defend it. That is not a partisan observation. It is a description of the last twenty years of both administrations and both congressional majorities.
So that is the backdrop this drawdown sits against. Debt that was never resolved after 2008, only relocated. A currency managed by an institution that has spent this decade behind the curve. And central banks around the world quietly converting reserves out of that currency — which is the detail that should hold your attention, because they are the ones with the clearest view of the machinery.
Let me say plainly where I stand, because you're entitled to know it rather than guess. I believe we are in the early stage of the largest monetary reset of my lifetime. I have believed it for years. I wrote a book about how we got here. Nothing in the last five years has made me less confident, and a great deal has made me more so.
Jim Rogers says the coming crisis will be the most painful of his. Ray Dalio calls the same thing the late stage of a long-term debt cycle. I won't hand you either as proof. Rogers has made a version of this warning for a decade, and a man who has been early for ten years is not thereby closer to being right. Being overdue is not evidence of anything.
Here is what is evidence. Federal debt stood near $18 trillion when Rogers began saying this. It has more than doubled since. Every year the warning went unanswered, the condition being warned about got measurably worse. That is a different claim from “he's due” — and it is the only one of the two I would put my name to.
What none of that gives me is a date. Conviction never does. Which is exactly why the section that follows matters more than this one.
The part I can't tell you
I have a view about the decade. I don't have one about the quarter. I don't know whether this is 1976 or 1981, and neither does anyone else, including the people who sound most certain. Goldman Sachs cut its year-end target to $4,900 in June. J.P. Morgan is at $4,500 for the fourth quarter and higher into 2027. Both remain above today's price, and both were revising in the opposite direction six months ago when gold was far more expensive. Forecasts revise. That is what makes them forecasts.
What I can tell you is that most people are asking the wrong question. “Will gold break out?” is a prediction. The useful version is: what position size lets me be wrong without it changing my retirement?
If gold rallying from here would make you feel vindicated, and gold falling another 20% would make you sell at the low, the position is too large — regardless of which way it eventually resolves. An asset held as insurance against monetary disorder has to be sized so you can hold it through the stretch where the insurance hasn't paid off yet. That stretch can last years. After 2011, it lasted nine.
The real question was never whether the breakout is coming. It is whether your plan survives both answers.
The reset thesis is developed at greater length elsewhere on this site: The Reset Dalio Sees Coming, What the Big Voices Are Saying, The Reckoning, and A Reckoning Without Borders.
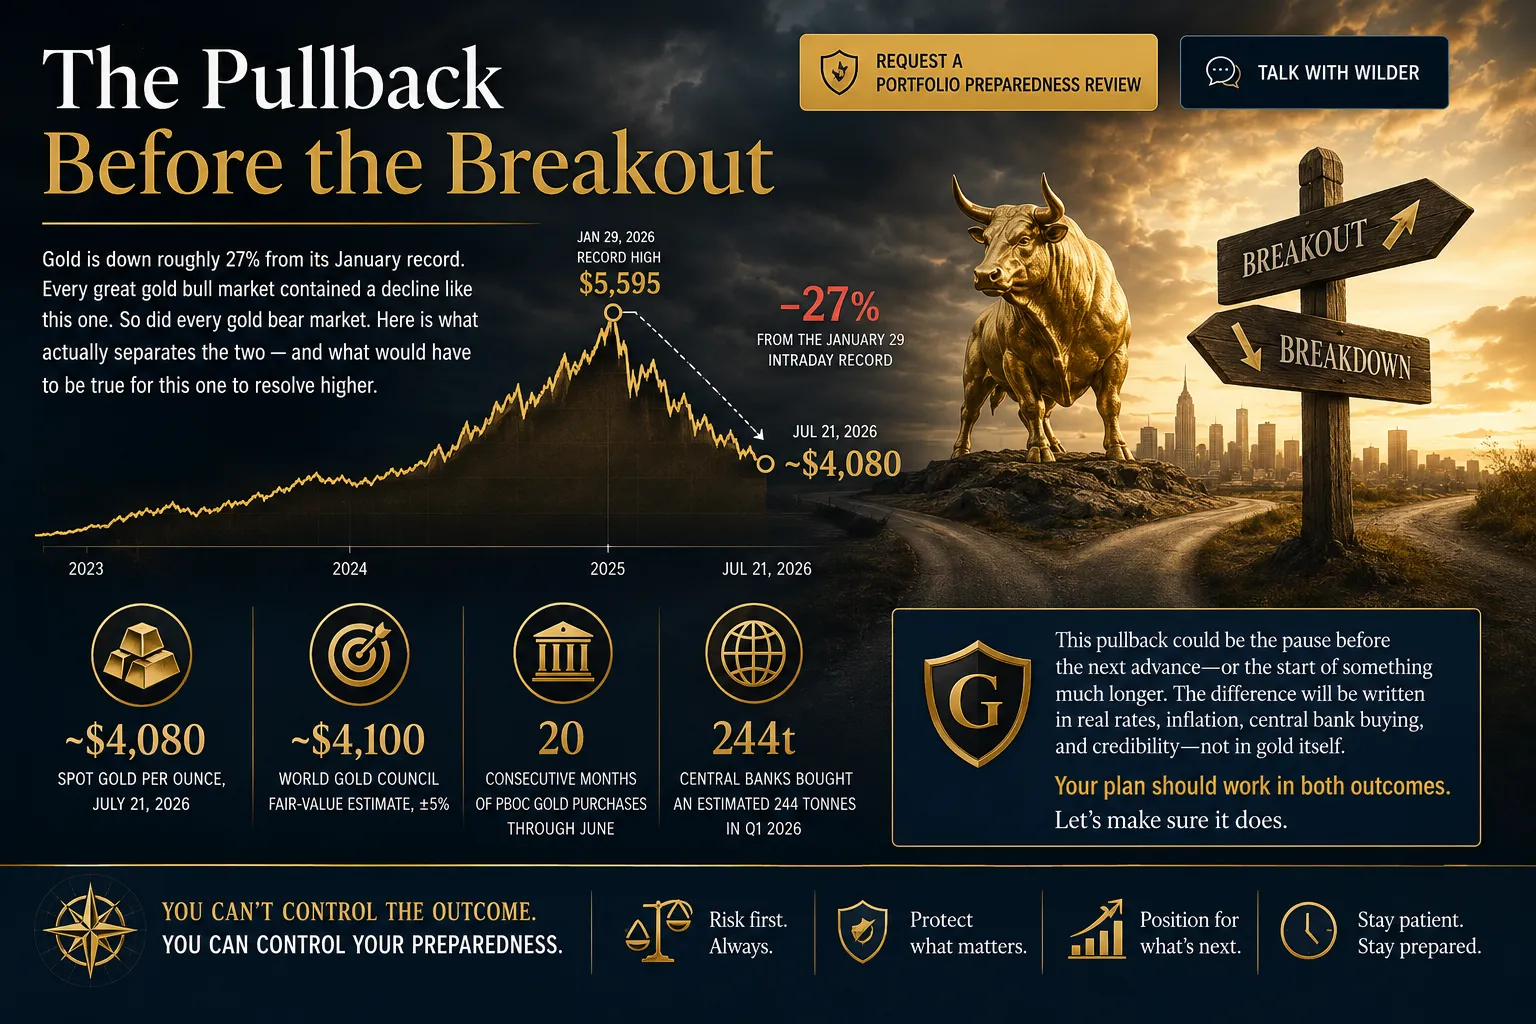
Gold, 2023 to July 2026. Spot price and drawdown figures as of July 21, 2026. Sources: World Gold Council, LBMA Gold Price, and China's State Administration of Foreign Exchange.
A gold position is a planning decision, not a trading decision.
If you own gold — or you've been wondering whether you should — the question worth answering isn't where the price goes next. It's how the position fits everything else: your withdrawal timeline, the concentration you may already carry elsewhere, and how much volatility your income can actually absorb. That's a conversation, not a forecast.