
Market Valuations
Why The Buffett Indicator Matters Right Now
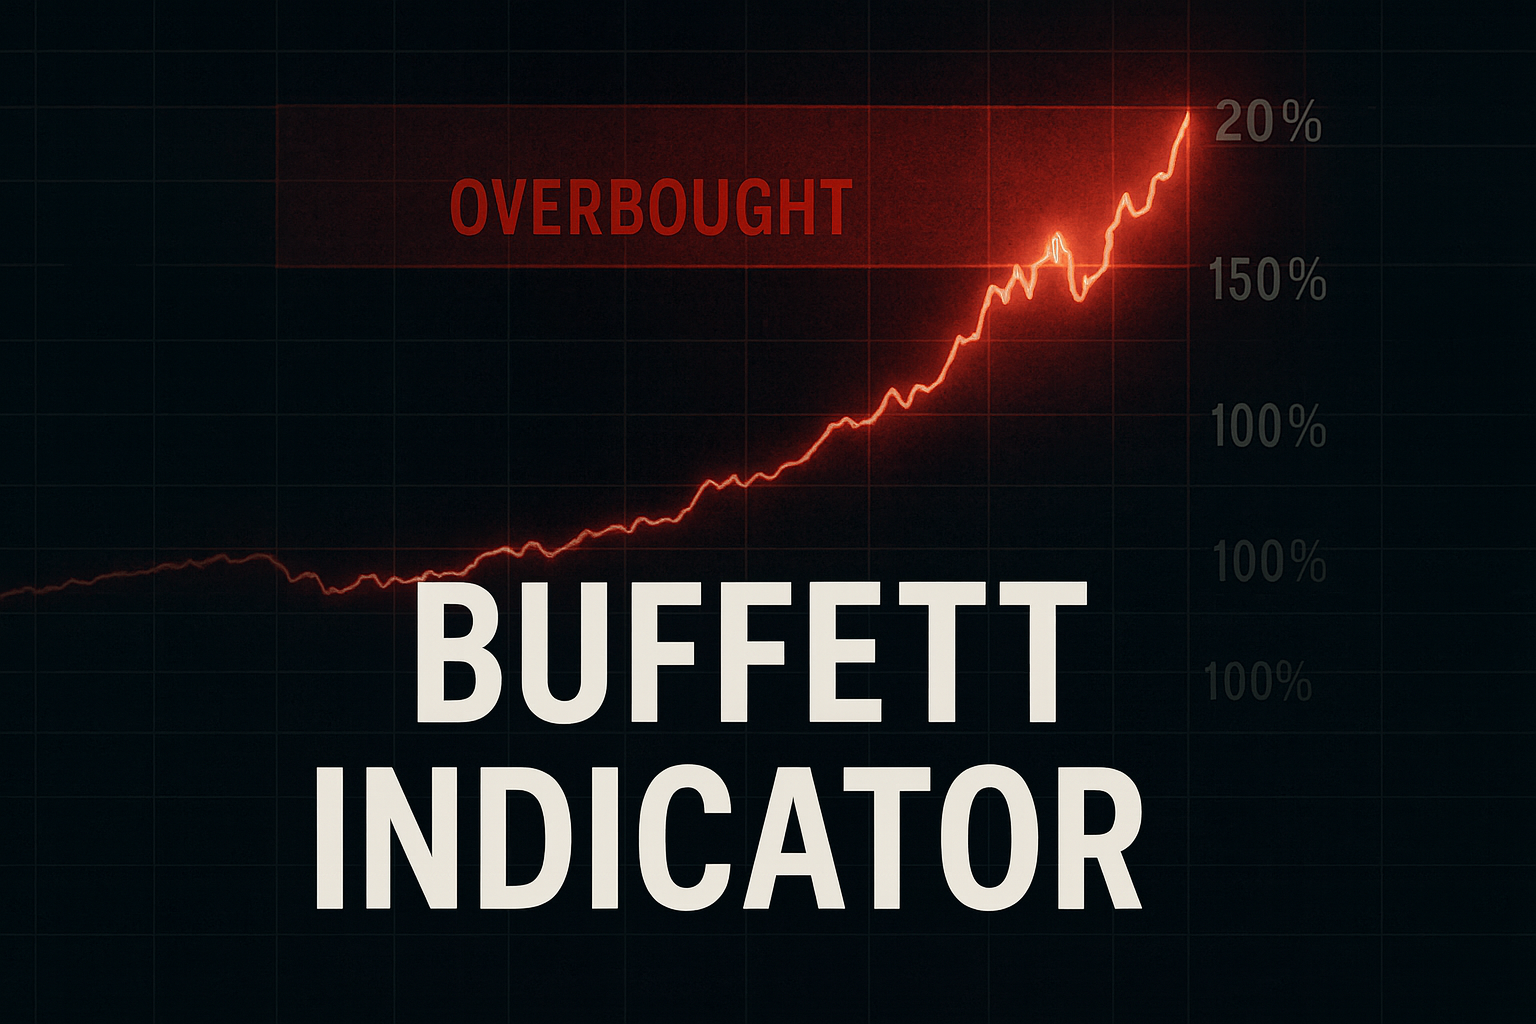
The Buffett Indicator compares the size of the stock market to the size of the real economy. Today, that ratio is hovering well above 200% – one of the highest readings in history. That should get every long-term investor’s attention.
The Indicator takes the total market value of all publicly traded U.S. stocks and divides it by U.S. GDP. When that number is low, it often means investors are getting a lot of real economic output for each dollar invested. When it’s very high, it signals that stock prices have run far ahead of the underlying economy and future returns may be much lower than what people have grown used to.
A Simple Ratio With a Big Message
At its core, the Buffett Indicator is straightforward:
- Total U.S. Stock Market Value – measured by broad indexes like the Wilshire 5000.
- Divided by U.S. GDP – the total economic output of the country.
When the ratio is near or below 100%, markets are roughly in line with the economy. When it surges far above 100% – especially for long stretches – it’s a sign that expectations and prices may be out of sync with reality.
The Buffett Indicator is not a precise timing tool, but it is a powerful sanity check on where we are in the larger market cycle.
Where the Buffett Indicator Sits Today
Different research sources calculate the exact number slightly differently, but they all agree on one thing: we’re in extreme territory. Recent estimates put the U.S. Buffett Indicator around 215%–220% of GDP, meaning the stock market is priced at more than double the size of the entire U.S. economy.
Historically, when the Buffett Indicator has climbed to these kinds of levels, future long-term returns have tended to be muted – sometimes even negative – for investors who simply stayed “all in” with no risk management.
You don’t have to predict the day or month of the next correction to see what the math is telling us: this is not a normal environment.
Video Insight
Understanding the Buffett Indicator in Today’s Market
This short video reinforces why valuations have reached historic extremes and why investors approaching or in retirement should be paying close attention. It adds helpful context to what this page is already highlighting.
What This Means If You’re Near or In Retirement
If you’re in your 50s, 60s, or already retired, a major drawdown from these levels isn’t just an uncomfortable headline – it can change the rest of your life:
- A large drop early in retirement can permanently reduce how long your assets last.
- Overvalued markets can hide risk in index funds and “set and forget” portfolios.
- Traditional 60/40 approaches may not be designed for bubbles in both stocks and other assets at the same time.
The Buffett Indicator doesn’t tell us exactly when the air will come out, but it does tell us that you should not be treating today’s market as business as usual.
How I Use the Buffett Indicator In Your Plan
In my practice, I don’t use the Buffett Indicator as a trading signal. Instead, I use it as part of a bigger risk-management framework:
- It helps set expectations for future returns from stocks at today’s prices.
- It informs how aggressively or conservatively we allocate across asset classes.
- It supports decisions about when to take risk off the table and when to lean into opportunity after major resets.
The goal isn’t to outguess the market day-to-day. The goal is to avoid being blindsided by a severe correction at a time in your life when you can’t easily “just ride it out.”
A Call to Action: Re-Evaluate Your Strategy Now
We are living through an historic period for investors. The Buffett Indicator is flashing a clear warning that valuations are stretched and future returns may look very different from the last decade.
If you’re unsure whether your current portfolio is built for this kind of environment, this is the time to get a second set of eyes on it. I’d be glad to walk you through what the Buffett Indicator – and other key measures – are saying about risk, and help you design a plan that’s aligned with your goals, your time frame, and today’s reality.
Reach out to us today

A Call to Action: Re-Evaluate Your Investments Now
As we face what could be one of the most significant market corrections in history, it's crucial to evaluate how your assets are invested. The time for complacency has passed. Now is the moment to reassess your portfolio, reduce exposure to high-risk investments, and strengthen your financial position with safer assets.
Consider incorporating asset classes that have historically benefited from market corrections. Embracing these proven strategies can help protect your financial future, ensuring you're not only prepared to weather the storm with the real possibility of growing your assets when the much overdue market correction occurs.
I'm here to help you make these critical decisions. With my expertise and personalized strategies, I can guide you in fortifying your financial future. Don't leave your assets to chance—reach out to me today to schedule a consultation. Together, we'll create a plan tailored to your needs, positioning you for stability and success no matter what the market brings.